
지도 시각화 방법
네이버, 카카오, Mapbox 등 지도 데이터를 제공하는 api를 활용한다면?

- 장점 - 지도를 그릴 필요 없고, 적은 코드로 시각화 기능을 구현할 수 있다.
- 단점 - 기본 디자인을 바꾸기 어렵고, 원하는 시각화 기능이 없을 수 있다. 사용량에 따라 요금이 부과될 수 있다.
svg나 canvas 같은 도화지에 지도부터 그린다면?
- 장점 - 그려지는 모든 요소를 컨트롤할 수 있고, d3 같은 시각화 라이브러리를 사용하면 동적인 그래픽을 만들 수 있다.
- 단점 - 더 많은 코드와 더 많은 상태 관리가 생긴다.
지도 데이터 준비
아무튼 지도를 직접 그리기로 했다면 지도 데이터에 대해 알아보자.
GeoJSON, TopoJSON
| 특징 | GeoJSON | TopoJSON |
| 데이터 구조 | 단순한 지리적 구조 (점, 선, 다각형) | 토폴로지 기반의 구조 (노드, 링크, 아크) |
| 중복 경계 처리 | 경계를 중복해서 저장 | 경계를 한 번만 저장하고, 여러 지역에서 재사용 가능 |
| 파일 크기 | 더 큼 | 압축되어 더 작음 |
| 지리 객체 간 관계 | 각 지리 객체가 독립적 | 경계를 공유하고, 객체 간의 관계가 정의됨 |
| 데이터 변환 | 일반적으로 더 직관적이고 사용이 쉬움 | 변환 도구를 사용해야 함 (예: GeoJSON ↔ TopoJSON) |
| 지원 범위 | 대부분의 지도 라이브러리에서 직접 지원 | D3.js 등 일부 라이브러리에서 직접 지원됨 |
https://github.com/vuski/admdongkor
GitHub - vuski/admdongkor: 대한민국 행정동 경계 파일
대한민국 행정동 경계 파일. Contribute to vuski/admdongkor development by creating an account on GitHub.
github.com
대한민국 geoJson 데이터를 제공하는 레포이다.
https://github.com/raqoon886/Local_HangJeongDong?tab=readme-ov-file
GitHub - raqoon886/Local_HangJeongDong: 대한민국 17개 광역시/도 행정동 GEOJSON 파일입니다.
대한민국 17개 광역시/도 행정동 GEOJSON 파일입니다. Contribute to raqoon886/Local_HangJeongDong development by creating an account on GitHub.
github.com
대한민국 geoJson 데이터에서 17개 광역시/도별 행정동으로 geoJson을 분리해 놓은 레포도 있다. (최근 업데이트는 아니다.)
mapshaper
Drop, paste or select files to import. Shapefile, GeoJSON, TopoJSON, KML and CSV formats are supported. Files can be zipped or gzipped.
mapshaper.org
위 사이트는 아까 깃헙에서 다운받은 GeoJSON을 TopoJSON으로 변환할 수 있다.

사이트에 geoJson을 업로드하고, Simplify 메뉴에서 경계를 단순화하며 데이터를 줄일 수 있고, Export 메뉴에서 TopoJson으로 다운로드할 수 있다.
지도 그리기 (React, D3)
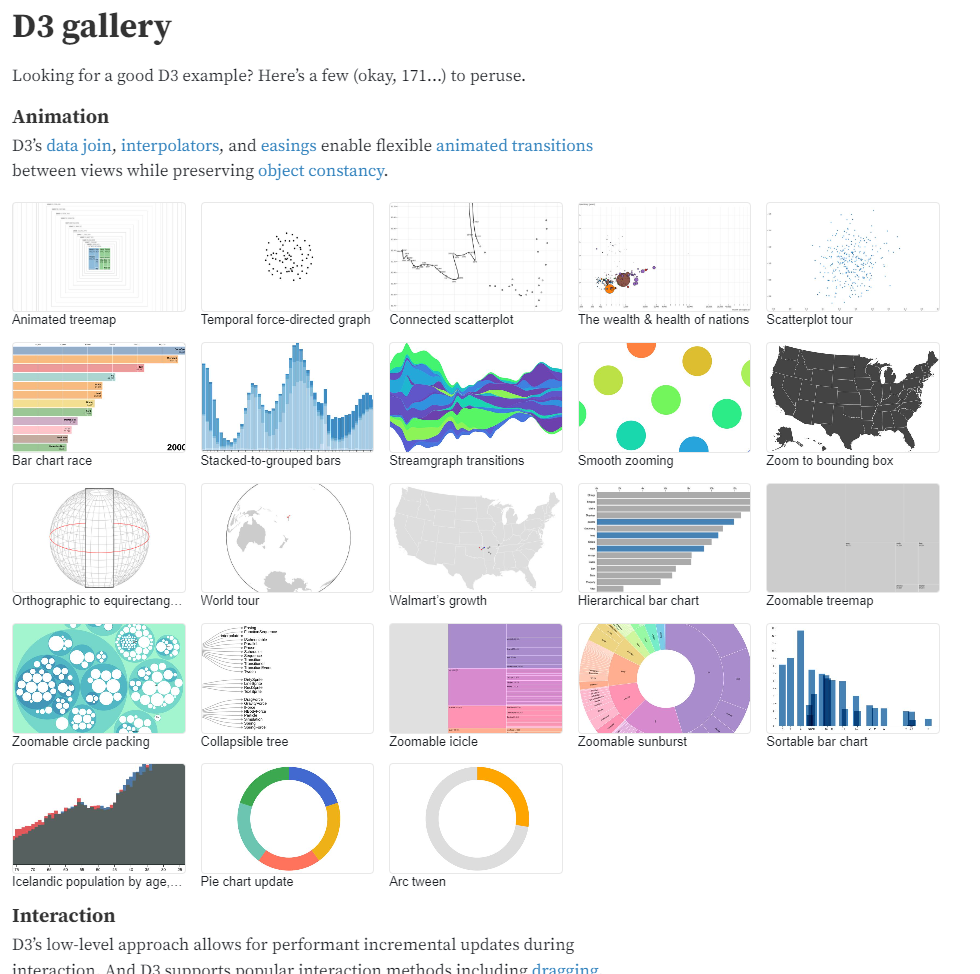
https://observablehq.com/@d3/zoom-to-bounding-box
Zoom to bounding box
Pan and zoom, or click to zoom into a particular state using zoom.transform transitions. The bounding box is computed using path.bounds.
observablehq.com
위 예제를 바탕으로 지도를 그려보자.

예제에서는 TopoJSON을 사용하고 있다. 강원도 GeoJSON -> TopoJSON 으로 변환하여 사용하였다.
참고로 D3.js는 DOM을 직접 조작하고 React는 가상 DOM을 조작한다.
그래서 react에서 컴포넌트가 마운트 된 후 d3로 DOM을 조작하도록 코드를 작성한다.
▼코드
import React, { useEffect, useRef, useState } from 'react';
import topoData from './강원도_topojson.json';
import * as topojson from 'topojson-client';
import * as d3 from 'd3';

export const MapVisualize = () => {
    const svgRef = useRef(null);
    const [name, setName] = useState('');

    useEffect(() => {
        if (svgRef.current) {
            const geoData = topojson.feature(topoData, topoData.objects.hangjeongdong_강원도).features;

            const zoom = d3.zoom().scaleExtent([0.3, 10]).on('zoom', zoomed);
            const width = svgRef.current.clientWidth;
            const height = svgRef.current.clientHeight;

            // 도화지 준비
            const svg = d3
                .select(svgRef.current)
                .attr('viewBox', [0, 0, width, height])
                .attr('width', width)
                .attr('height', height)
                .attr('style', 'max-width: 100%; height: auto;')
                .on('click', reset);

            // 투영법 설정
            const projection = d3
                .geoMercator()
                .center([128.35, 37.68]) // 목표 좌표로 중심 설정
                .scale(28000) // 초기 스케일 설정
                .translate([width / 2, height / 2]); // SVG의 중앙으로 이동

            const path = d3.geoPath().projection(projection);

            const g = svg.append('g');

            // 땅 그리기
            const states = g
                .append('g')
                .attr('fill', '#444')
                .attr('cursor', 'pointer')
                .selectAll('path')
                .data(geoData)
                .join('path')
                .on('click', clicked)
                .attr('d', path);

            svg.call(zoom);
            states.append('title').text((d) => d.properties.adm_nm);

            // 경계선 그리기
            g.append('path')
                .attr('fill', 'none')
                .attr('stroke', 'white')
                .attr('stroke-linejoin', 'round')
                .attr('d', path(topojson.mesh(topoData, topoData.objects.hangjeongdong_강원도, (a, b) => a !== b)));

            function reset() {
                states.transition().style('fill', null);
                setName("");
                svg.transition()
                    .duration(750)
                    .call(zoom.transform, d3.zoomIdentity, d3.zoomTransform(svg.node()).invert([width / 2, height / 2]));
            }

            function clicked(event, d) {
                console.log(d.properties.adm_nm);
                setName(d.properties.adm_nm);
                const [[x0, y0], [x1, y1]] = path.bounds(d);
                event.stopPropagation();
                states.transition().style('fill', null);
                d3.select(this).transition().style('fill', '#181818');
                svg.transition()
                    .duration(750)
                    .call(
                        zoom.transform,
                        d3.zoomIdentity
                            .translate(width / 2, height / 2)
                            .scale(Math.min(8, 0.5 / Math.max((x1 - x0) / width, (y1 - y0) / height))) // AAA
                            .translate(-(x0 + x1) / 2, -(y0 + y1) / 2),
                        d3.pointer(event, svg.node())
                    );
            }

            function zoomed(event) {
                const { transform } = event;
                g.attr('transform', transform);
                g.attr('stroke-width', 1 / transform.k);
            }
        }
    }, []);
    return (
        <div
            style={{
                width: '100vw',
                height: '100vh',
                backgroundColor: '#e2e2e2',
                display: 'flex',
                justifyContent: 'center',
                alignItems: 'center',
                flexDirection: "column"
            }}
        >
            <h1>{name}</h1>
            <div
                style={{
                    width: '80%',
                    height: '90%',
                    backgroundColor: '#acacac',
                }}
            >
                <svg
                    ref={svgRef}
                    style={{
                        width: '100%',
                        height: '100%',
                        border: '1px solid white',
                    }}
                ></svg>
            </div>
        </div>
    );
};
function clicked()에 AAA 주석 부분 수식에서
0.5는, svg size보다 큰 state에서는 비율을 축소해서 보여주고, 작은 state에서는 비율을 확대해서 보여주겠다는 거다.
앞에 8은, 큰 state의 경우 축소해서 보여주는데, 그때 scale에 상한을 걸어두는 숫자이다.
'SW > front-end' 카테고리의 다른 글
| (GIS)지도 데이터 시각화, R-tree 알고리즘 (1) | 2024.11.21 |
|---|---|
| mapshaper - 대한민국 행정동 지도 데이터 다루기 (0) | 2024.11.06 |
| 최적화 관련 useRecoilState, useState (0) | 2023.08.25 |
| react contextMenu 만들기 (0) | 2023.08.24 |
| 채팅-React.memo() (0) | 2023.08.22 |